Sunday, April 24, 2011

Climograph

http://pulse.pharmacy.arizona.edu/9th_grade/from_global/earth_science/climate_patterns.html

A climograph is a graphic tool used to display the precipitation and temperature of a specific area over the course of a year. It is designed to show what the climate is like throughout the year. The temperature is usually show as a line graph, while the precipitation is usually a histogram.

Star Map

http://csep10.phys.utk.edu/astr161/lect/time/maps.html

A star map projects constellations in a easy to understand 2D projection. It is difficult to map out the stars because it is a vast 3D world with large distances between stars. This map was made to show what and where constellations would be visible at a certain time and place in the year. If that information wasn't given the map would not be accurate for every place and time.

Venn Diagram

http://www.learnnc.org/glossary/Venn+diagram

Venn diagrams are used to show the relation between two or more things. Each circle has characteristics of the object. Parts of the circle overlap with another circle, this means that the both share that characteristic. When looking at a venn diagram it is easy to visually see how one thing relates to another.

Stem and leaf plot

http://www.mathsisfun.com/data/stem-leaf-plots.html

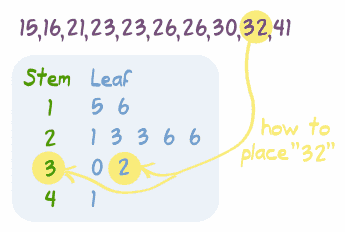
Stem and Leaf plots are mathematical diagrams that show values and how often the occur. They are particually useful in finding the min, the max, and the mode (most often occuring number.) Though not always the most useful to visual break down the numbers and the relationships, it does have some advantages.

Conic Projection Map

http://www.progonos.com/furuti/MapProj/Normal/ProjCon/projCon.html

The conic projection map is a map that is shown from one of the poles. The conic map has the least distortion at the polar region being projected. These maps are useful in showing Canada, Scandinavia and  Russia.

Triangle Plot

http://www.dplot.com/triangle-plot.htm

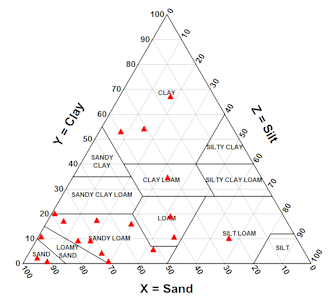
The triangle plot has the variable mapped out. Each variable has its own axis with its own values, x, y, and z. In the image above soil type is mapped out with three different components, Clay, silt, and sand. Looking at the map you can see that different proportions of soil texture produce different soils.

Box Plot

http://www.physics.csbsju.edu/stats/box2.html

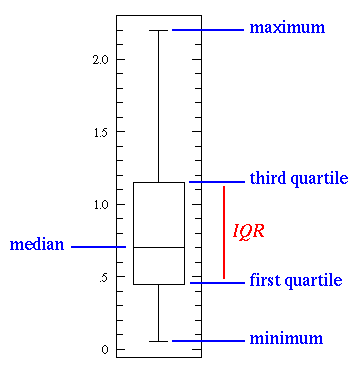
 A box plot is a statistical graph that breaks the data up into several categories. Where the number falls on the plot represents where that value is in relation to all of the other values. If it is not the Max or the min than it fall between those values. The median or middle number is also represent so it could be between the max and the median or the min and the median. Which quartile can also be determined.