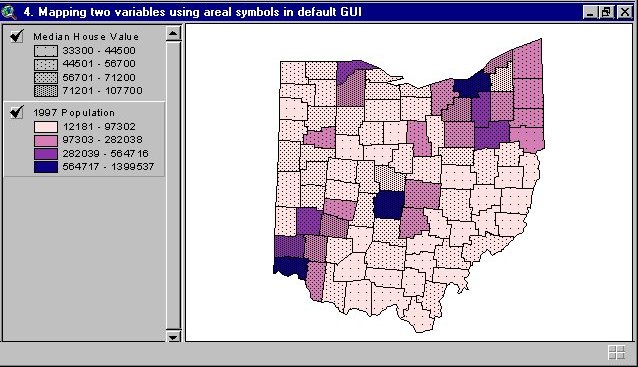
Bivariate choropleth maps are choropleth maps that show two variables. An easy way of producing a bivariate map is to have color represent one variable and texture to represent the other. Bivariate maps are used to see if one variable might have an effect on the other. The map about uses shades of purple to show population and texture to show median home prices. Home values appear to be higher in areas with higher population, thus we can conclude that population has an effect on home values.
No comments:
Post a Comment