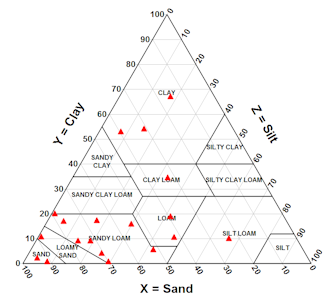
The triangle plot has the variable mapped out. Each variable has its own axis with its own values, x, y, and z. In the image above soil type is mapped out with three different components, Clay, silt, and sand. Looking at the map you can see that different proportions of soil texture produce different soils.
No comments:
Post a Comment