Sunday, April 24, 2011

Nominal area choropleth map


http://cippinonsports.com/page/3/
(scroll down a bit)

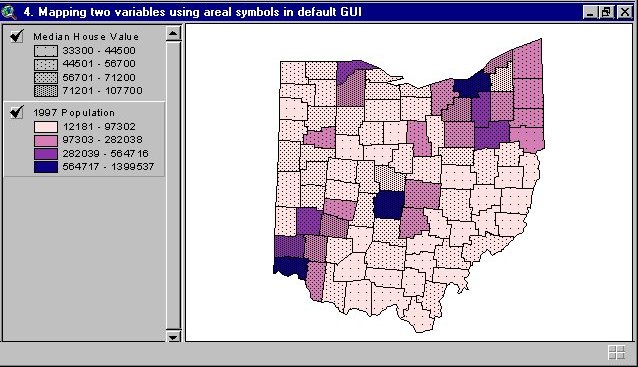
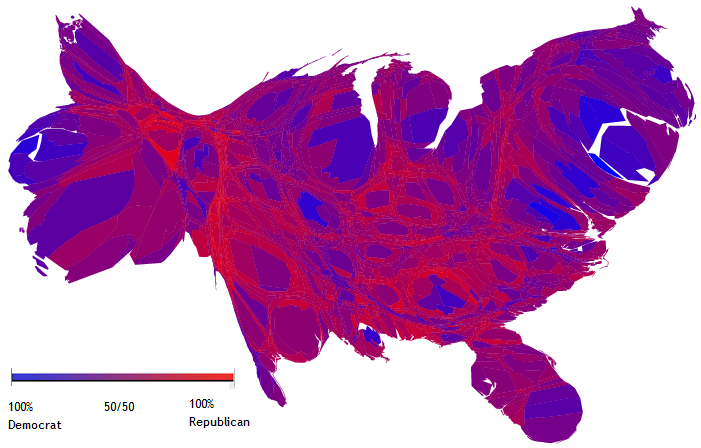
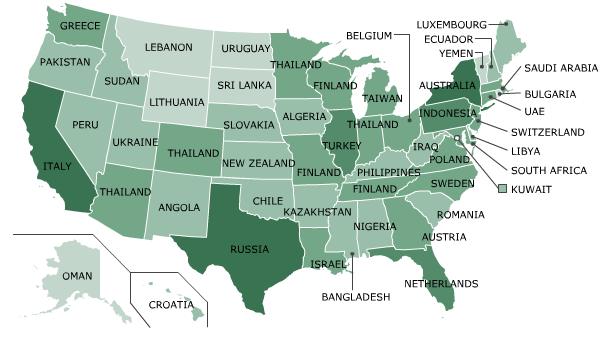
This choropleth map shows the location of NFL team fan bases across state lines. This is a fun look to see how states with multiple teams get divided up and how states without at team root for. While it would be hard to prove the accuracy of the map, it does do a good job of showing sports regions within the United States.

McArthur's Universal Corrective Map

http://flourish.org/upsidedownmap/

The McArthur projection shows a map that is typically deemed to be upside, yet it is still an accurate representation of the world. It bias is for Australia and all other Southern Hemisphere countries to show that they are not on the bottom of the world. This map is not just turner upside down but also projected to more accurately display the southern hemisphere counties.

Portolan Chart

http://www.visualphotos.com/image/2x2912068/portolan_chart_of_italy_and_greece

Portolan charts were extremely accurate, for the time period, of coast lines in Europe. The maps were designed for navigation of boats. The maps were made by placing points and connecting them with rhome lines. These were highly regarded during the middle ages and are known for their stylized drawings.

Plot Diagram

http://www.d.umn.edu/~moor0145/plotdiagram.htm

The plot diagram is a map of the action/plot of the book. I takes the plot of the book and places it on a ^ like line. From this you can easily see where each part of a book would be placed. This map goes into more detail than just beginning middle and end. The distance between point might be short, just a couple pages, while others may be hundreds of makes depending on the book.

T O Map

http://www1.georgetown.edu/departments/medievalstudies/

An artistic map from the middle ages, the T O map got its name from the T shape of the continents. These maps show Europe, Africa and Asia, with Jerusalem at the cross of the T. These maps would have Asia on top with Europe on the bottom left and Africa on the bottom right. These maps often had religious symbology.

Subway map

http://www.gsd.harvard.edu/admissions/visiting/subway.html

A subway map is a type of mental map that shows the route of a subway system. These are often to drawn to scale, shape, and have no geographic reference points. The show the lines of the subway, different colors to show different lines, and each stop along the way in order. The stops might appear close to each other but end up being miles apart. They are designed for passengers to easily see which line they want and which stop to get off at.

Orbital Map

http://www.challenger.org/programs/iss/iss.cfm

Mapping out the orbit of the space station presents a lot of problems. Since the earth is rotating and the space station is moving, the location compared to a fixed point on earth is constantly changing. The you might think that the space station goes around in a circle but if you look at the map above to shows that to orbit is not round and changes every time it orbits the Earth. NASA had to make special map projections in order to accurately display the orbit.

Climograph

http://pulse.pharmacy.arizona.edu/9th_grade/from_global/earth_science/climate_patterns.html

A climograph is a graphic tool used to display the precipitation and temperature of a specific area over the course of a year. It is designed to show what the climate is like throughout the year. The temperature is usually show as a line graph, while the precipitation is usually a histogram.

Star Map

http://csep10.phys.utk.edu/astr161/lect/time/maps.html

A star map projects constellations in a easy to understand 2D projection. It is difficult to map out the stars because it is a vast 3D world with large distances between stars. This map was made to show what and where constellations would be visible at a certain time and place in the year. If that information wasn't given the map would not be accurate for every place and time.

Venn Diagram

http://www.learnnc.org/glossary/Venn+diagram

Venn diagrams are used to show the relation between two or more things. Each circle has characteristics of the object. Parts of the circle overlap with another circle, this means that the both share that characteristic. When looking at a venn diagram it is easy to visually see how one thing relates to another.

Stem and leaf plot

http://www.mathsisfun.com/data/stem-leaf-plots.html

Stem and Leaf plots are mathematical diagrams that show values and how often the occur. They are particually useful in finding the min, the max, and the mode (most often occuring number.) Though not always the most useful to visual break down the numbers and the relationships, it does have some advantages.

Conic Projection Map

http://www.progonos.com/furuti/MapProj/Normal/ProjCon/projCon.html

The conic projection map is a map that is shown from one of the poles. The conic map has the least distortion at the polar region being projected. These maps are useful in showing Canada, Scandinavia and  Russia.

Triangle Plot

http://www.dplot.com/triangle-plot.htm

The triangle plot has the variable mapped out. Each variable has its own axis with its own values, x, y, and z. In the image above soil type is mapped out with three different components, Clay, silt, and sand. Looking at the map you can see that different proportions of soil texture produce different soils.

Box Plot

http://www.physics.csbsju.edu/stats/box2.html

 A box plot is a statistical graph that breaks the data up into several categories. Where the number falls on the plot represents where that value is in relation to all of the other values. If it is not the Max or the min than it fall between those values. The median or middle number is also represent so it could be between the max and the median or the min and the median. Which quartile can also be determined.

Brainstorm Mapping

http://speakingaboutpresenting.com/content/brainstorming-sabotage-presentation/

A brainstorming map is a diagram of thought. At the center is an idea with lines radiating outwards. From the those lines form lines and so on. The idea of the brainstorm is to map out a thought process on paper. The example above involves financial planning  at the core. From setting up a company, saving, planning and other ideas jolt out from the center. The brain storm could contain just one or two sub thoughts or thousands of levels.

Time Line


http://nazifsalleh.wordpress.com/2008/08/05/iphone-timeline/

A time line is a line that maps out event based on time. Usually time lines run from left to right. Time lines map out events so one can see what order events occurred and its relationship to other events. In the time line above, the progression of the Iphone is mapped out. From the beginning, Apple registering the name Iphone furthest to the left, to the release of the first generation in the middle, and release of the iphone internationally at the end.

Family Tree


http://www.yangfamilytaichi.com/yang/tree/
A family tree is a mental map of someones ancestry. It can begin with a current person and go back in time with parent, grand parent etc, or start from a person and go foward, kid, grand kids etc. Family Trees are good for understanding how you are connected to your cousins, second cousins and farther fringes of your family. The tree above begins with Yang Fu Kui born in 1799 and ends with people being born in 2002. The maps can show multiple generations with lots of branches or be  small and only show a handful of people.

Scatter Plot

http://www.qimacros.com/qiwizard/scatter-plot.html

The scatter plot is a type of graph that plots points in relation to the x and y axis. In the example about Calories consumed is being compared to weight gained. For this map the more calories consumed means the more weight gained, a positive correlation.  

Similarity Matrix

The similarity matrix is boxed graph with the same information on each axis. The matrix is designed to show the similarity between different points. Because of the nature of the matrix there will be one diagonal line with a similarity of one because each variable will have a similarity of one to its same variable. Where the matrix is useful is show time and distance similarities between different locations.

Metes and Bound Map

http://www.arslanmb.org/head/head.html

This is a map made based on information given about the land based on Metes and Bounds. Before the PLSS, property was explained using metes and bounds. The process used georeference points to explain where a articular piece of property began, things like large trees, rivers, hills, etc. The method was very unsytematic and left lots of room for error. When examining old records it could be hard to understand the current property rights because trees may have been cut down, rivers changed their flow and other events. The above image details a piece of property in virginia owned my James Madison.

Friendship Map (Social Network Map)

http://pirie.typepad.com/1/2008/02/does-social-med.html

The graph aboves shows the interconnections between friends on facebook. At center is Elliot Back and each line radiating out is a different friend of his on facebook. From there we can see that some of his friends are also friends of friends. From the map we can see the connections and friend blocks.

Map of the Internet

http://www.cheswick.com/ches/map/gallery/index.html

The image above is a map of the internet.  It shows the connections of computer based on IP addresses. It is more of an artistic map than one to navigate. The lines begin at major IP providers and branch out to servers, website hosts, and finally users.

Periodic Table

http://www.bpc.edu/mathscience/chemistry/history_of_the_periodic_table.html

The periodic table is a map of all of the known chemical elements. The map is not based on geographic location, but on size. Looking at the table we can see that there are some elements that are located next to each other have similar properties. We can also learn to read the table to find out which elements will bond together and which ones don't need to bond to anything.

Wind Rose

http://www.vistadatavision.com/reports-2/wind-rose/

A wind rose diagram is a graph that shows the the characteristics of wind from a fixed point. The first characteristic is direction, where the lines points out to. Frequency is shown by how far the line jolts out from center. Wind speed is related to the color of the line.

Population Profile Map

http://www.census.gov/history/www/reference/maps/population_profile_maps.html

The Population profile of Texas includes a  choropleth map with population density, a pie chart of racial background, and a population pyramid. From the profile you can spatially see that the population is primarily white, under 40 years old and lives on the eastern half of the state.

Bivariate choropleth maps

http://proceedings.esri.com/library/userconf/proc99/proceed/papers/pap171/p171.htm

 Bivariate choropleth maps are choropleth maps that show two variables. An easy way of producing a bivariate map is to have color represent one variable and texture to represent the other. Bivariate maps are used to see if one variable might have an effect on the other. The map about uses shades of purple to show population and texture to show median home prices. Home values appear to be higher in areas with higher population, thus we can conclude that population has an effect on home values.

Classified Choropleth Map

http://illinoisstate.edu/~jrcarter/Geo204/Choro/Tom/

Classified Choropleth maps are thematic maps that use color to identify the differences in the theme of the map. The raw data is divided up in to classes, with each class having its own color. In the map above Florida is divided in to counties. The map displays the Hispanic population based on percent of the population. From the map you can easily see that the southern Florida has a much larger Hispanic population than the rest of Florida. Choropleth maps are designed to easily break down data into classes so that the data can easily be mapped.

Digital Orthophoto Quarter-Quadrangles (DOQQ)

http://en.wikipedia.org/wiki/Orthophoto

DOQQ use aerial photos that have been digitally corrected to avoid distortion from topography, camera angle etc. These true images have a accuracy of a map and a photo. While the process is extremely expensive, these maps are also extremely useful. The image above and an orthophoto of the National Mall in Washington DC.

Digital Elevation Model (DEM)

http://www.washingtonstatesearch.com/Washington_maps/Washington_State_digital_elevation_map.html

The DEM above shows the US State of Washington and its elevation levels. This image does not include a legend with what color equals what elevation level, but it is still easy to see that there are some large differences in elevation.  DEMs gather elevation data from a number of sources, LIDAR, GPS, Topographic maps and more. DEMs are fully digital models and not photographs or maps with elevation data laid on top.

Digital Line Graph Map

http://pubs.usgs.gov/of/2003/of03-471/domier/index.html

Digital Line Graph Map are digital vector maps produced by the USGS. Vector are points lines and polygons and are different than raster. Vector line maps have much finer line points that raster images and is useful for political boundaries and road maps. The image above shows elevation levels using contour lines and roads.

Digital Raster Graphic Maps

http://www.nysgis.state.ny.us/gisdata/quads/about/drg.htm

Digital raster graphic (DRG) are digitized maps from USGS topographic maps. Because DRGs are digital, accurate and have been Geocoded, they are often used in GIS maps. The map above shows the location of Corning Community College in NY.

Isotach Map

http://www.crh.noaa.gov/lmk/?n=paper-1/17/94


Isotach maps have lines with areas of equal wind speed. Like contour lines areas with lines close together show dramatic shifts in wind speed. In this map from NOAA shows the center of the United States and its wind speeds. Wind speed is fairly constant over Georgia, while the its a huge change of wind speed in Texas/Oklahoma. Isotach maps have a large role within  meteorology.

Isobar map

http://www.solcomhouse.com/windpower.htm

Isobar maps use lines to show areas with the same atmospheric pressure. Meteorology uses Isobar maps a lot when talking about high and low pressure systems. When the lines are closer together it means that there is a large drop off in air pressure over a short area. This map from NOAA shows the Continental United States and areas of High Pressure Kansas City, and areas with low pressure along the Appalachia Mountains.

LIDAR

http://rst.gsfc.nasa.gov/Sect8/Sect8_8.html

LIDAR (Light Detection And Ranging) uses lasers to map out an area. Lasers are shot out and bounce back from an object and repeated to show the features of the object. LIDAR produces extremely accurate images with lots of detain and can even make 3D images such as the exaple of downtown Kansas City above. LIDAR is good at showing size and distance of objects.

Doppler Radar

http://www.deadlystorms.com/storms/2004/2004%20charley/videos.htm

Doppler Radar uses the doppler effect to show the movement of weather systems. In this image the Doppler radar is able to show the location, intensity, and movement of Hurricane Charley. Doppler images are used primarily for weather systems, however other images and be produced.

Black and White Aerial Photography

http://www.math.toronto.edu/~drorbn/Gallery/KnottedObjects/Interchange/

Black and White aerial photography is an element of remote sensing that uses photographs taken from satellites or planes using the visible light spectrum. This photo shows an interchange on I-95 in Baltimore. The black and white shows enough contrast for details to be seen. B&W photos are cheaper than colored photos so when color is not needed it works as a good alternative.

Infrared aerial photography

http://www.nps.gov/lyjo/naturescience/naturalfeaturesandecosystems.htm

Infrared aerial photograph are an element of remote sensing. It is a picture taken from the air, via satellite, plane, balloon, etc, and instead of using the visual light spectrum the infrared spectrum is used. The infrared spectrum is used to show feature that might not be seen in the visible light spectrum. Some uses of infrared photography include organic material (plant life), and areas with low amounts of visual light. Aerial photography is good because despite taking a picture of a large area, with today's technology great detail can still be captured.

Cartographic animations

http://en.wikipedia.org/wiki/Animated_mapping

Cartographic animations use moving pictures to show the change of one variable over space. This example shows the movement, over time sped up for ease of use, of the 2004 Indian Ocean Tsunami. The animation helps show how geography changed the tsunami flow. The map also shows the locations that were heavily hit by the wave.

Cartogram

http://en.wikipedia.org/wiki/Cartogram

A Cartogram is a type of thematic map which distorts the geographic space in order to emphasize a different variable. In this map the spacial map of the United States is distorted to show the population. This map also has a choropleth element showing the election results of the 2000 election.

Flow Maps

http://en.wikipedia.org/wiki/Flow_map

Flow maps are a mix of maps and charts, infographic, to show the movement of goods, objects, people, information and ideas. They are very useful when studying transportation, and movements. In this example we see the exportation of French wines. The lines start out thick when leaving France and break apart to eventually become thin lines connecting to the country importing the wine. This is a very good example because it also shows a ratio of where the wine is going. From this map we can make inferences into who has strong economic ties with France and what countries are interested in French wine.

Isoline maps


http://regentsprep.org/regents/core/questions/questions.cfm?Course=ESCI&TopicCode=07

Isoline maps use lines, continuous, to show areas with equal values for a given them. In this example the isolines are used to show precipitation. The area that runs along the line add equal amounts of precipitation. Isoline maps have a lot of uses within the realm of thematic mapping and are used to show continuous data, unlike choropleth maps.

Proportional circle maps

http://personal.frostburg.edu/sbriggs0/maps.htm

 Proportional circle maps are a type of thematic map. They use different size circles to visually show how one state compares to another. In this case we are looking at the theme of farm size in each state. These maps are similar to choropleth maps.

Dot distribution maps

http://www.mobot.org/jwcross/duckweed/Habitat/geography.html

This map is a good example of a Dot Distribution Map. From the website it states "Each dot indicates an area of duckweed occurrence." Dot Distribution maps are good for displaying populations, locations of events over time, and other data over a geographic space. They can be simple to produce, one dot to one event, or more complicated, one dot equals 1000 events.

Another cool example is the video of world history according to wikipedia. A dot is used for each entry into wikipedia.
http://gizmodo.com/#!5783985/wikipedias-history-of-the-world-visualized

Propaganda maps

http://www.stopthedrugwar.org/speakeasy/2008/nov/04/drug_czar_mixes_cannabis_caffein

 Propaganda maps are made to distort geographic features to emphasize and promote a certain idea. In the map, made by an anti-medical marijuana group, suggests that there are more marijuana shops that Starbucks coffee places in San Francisco. By looking at the map one would be led to believe that there are too many marijuana stores. The map maker may have used a definition of "Medical Marijuana Dispensaries" that is inconsistent with typical norms inorder to make it appear as if there were more than actually present. Propaganda maps have been used for as long as maps have been made. Some are made with the intention of it being known as biased, while others will try to hide the bias in order to appear to be accurate.

Hypsometric Map


Hypsometric Maps are a type of topographic map. Instead of using contour lines to show elevation, hypsometric maps use color and shading to display elevation. While some maps may use gradient color schemes, other may use classification blocks. These maps are used a lot for world maps and globes. They are an easy way to show the relief of the land and are often easily accessible. 

PLSS Map

http://www.ak.nrcs.usda.gov/technical/plss.html

PLSS Map, Public Land Survey System. The PLSS is a systematic way of organizing the land in the US. To begin you start at a Meridian Line running North/South and a Base Line running East/West. From there you have townships made of of six miles by six miles  blocks of land. Finally you take the townships and break them down in to one mile my one mile blocks of land. These maps are used for Surveying, property ownership, and as a way of classifying land.

Cadastral map

http://www.aplr.org/?id=299&pid=650

Cadastral  maps keep track of legal boundaries of properties. Cadastral maps are often created by city governments in order and made as public records. The city governments use these maps for property value taxes. Real Estate offices will also use these maps when selling property. It is important that these maps are extremely detailed, up to date, and accurate.

Thematic Map


Thematic maps display a theme mapped out over a geographic map. In this example we see the location of Land Reserves (theme) on the island of Hawai'i (Geographic area). On this map they break down the theme into multiple categories, state, federal, and private, along with the use of the land. Thematic maps play a large role in the GIS area of geography.

Topographic Map

http://www.newcityvision.net/resources.html
(Click Topographic Map on left side)

A topographic map is shows a birds eye view using a horizontal axis. What makes this map different from others, such as Planimetric, are  the inclusion of contour lines to show elevation. The map specifically would be good to find the areas of high elevation and low elevation. Areas of low elevation might me high chances of flooding.

Planimetric map


(Click the Planimetric map link on the left) 


The map is a good example of a planimetric map because it is taken from a birds eye view showing only the horizontal features and does not show any elevation. The map shows the lay out of a city with multiple neighborhoods, parks and shopping areas. This map would be useful as a road map as well as a map to see the distance between two places within the city.